环境概览
组件 | 版本 |
|---|---|
ElasticSearch | 8.2.0 |
Logstash | 8.2.0 |
Kibana | 8.2.0 |
Filebeat | 8.2.0 |
Kafka(可选) | 2.12 |
下载相关组件安装包
将下载的组件包统一放在服务器的/usr/local/elk目录
mkdir /usr/local/elk -p
cd /usr/local/elk
wget https://artifacts.elastic.co/downloads/elasticsearch/elasticsearch-8.2.0-linux-x86_64.tar.gz	#下载elasticsearch
wget https://artifacts.elastic.co/downloads/logstash/logstash-8.2.0-linux-x86_64.tar.gz		#下载logstash
wget https://artifacts.elastic.co/downloads/kibana/kibana-8.2.0-linux-x86_64.tar.gz	#下载kibana
wget https://artifacts.elastic.co/downloads/beats/filebeat/filebeat-8.2.0-linux-x86_64.tar.gz	#下载filebeat
yum install java-1.8.0-openjdk.x86_64      #安装jdk运行环境
安装ElasticSearch
tar -zvxf elasticsearch-8.2.0-linux-x86_64.tar.gz
cd elasticsearch-8.2.0
useradd es     #创建es用户
chown -R es:es /usr/local/elk/elasticsearch-8.2.0   #安装目录权限
mkdir -pv /data/es/{datas,logs}      #创建日志和数据目录
chown -R es:es /data/es/         #修改日志和数据目录权限
vim config/elasticsearch.yml     #修改es配置文件
配置文件如下,本次我们采用单节点模式部署
cluster.name: es-elk      #集群名
node.name: es-elk-node1       #节点名
path.data: /data/es/datas    #数据目录
path.logs: /data/es/logs     #日志目录
network.host: xx.xx.xx.xx  #主机IP,替换为自己服务器IP
http.port: 9200    #监听端口
初始化elasticsearch
su es -		#切换为es用户
cd /usr/local/elk/elasticsearch-8.2.0/bin/
./elasticsearch  #前台启动或:./elasticsearch -d 后台启动
首次启动会输出以下信息
✅ Elasticsearch security features have been automatically configured!
✅ Authentication is enabled and cluster connections are encrypted.

ℹ️  Password for the elastic user (reset with `bin/elasticsearch-reset-password -u elastic`):
  xV6gX_=ZzpGIY9vAjY*h          #默认生成的elastic用户的密码

ℹ️  HTTP CA certificate SHA-256 fingerprint:
  5428f946073fd977439a2de38cc110ca367493c5fc0e77e4c2b7df21b79b44c2

ℹ️  Configure Kibana to use this cluster:     #使用kibana连接es时的token,30分钟有效
• Run Kibana and click the configuration link in the terminal when Kibana starts.
• Copy the following enrollment token and paste it into Kibana in your browser (valid for the next 30 minutes):
  eyJ2ZXIiOiI4LjIuMCIsImFkciI6WyIxOTIuMTY4LjEuMTg4OjkyMDAiXSwiZmdyIjoiNTQyOGY5NDYwNzNmZDk3NzQzOWEyZGUzOGNjMTEwY2EzNjc0OTNjNWZjMGU3N2U0YzJiN2RmMjFiNzliNDRjMiIsImtleSI6IlZHU01jb1lCTW1qMjVyTlNMOVRvOmlQWmcxX29BVEJpLUZWbkpDQjdtZ0EifQ==

ℹ️ Configure other nodes to join this cluster:   #其他节点加入次集群时的token
• Copy the following enrollment token and start new Elasticsearch nodes with `bin/elasticsearch --enrollment-token <token>` (valid for the next 30 minutes):
  eyJ2ZXIiOiI4LjIuMCIsImFkciI6WyIxOTIuMTY4LjEuMTg4OjkyMDAiXSwiZmdyIjoiNTQyOGY5NDYwNzNmZDk3NzQzOWEyZGUzOGNjMTEwY2EzNjc0OTNjNWZjMGU3N2U0YzJiN2RmMjFiNzliNDRjMiIsImtleSI6IlZtU01jb1lCTW1qMjVyTlNMOVR0OkVMRWE3Xy0wUm02ZnZlMFNNanphTkEifQ==

  If you're running in Docker, copy the enrollment token and run:
  `docker run -e "ENROLLMENT_TOKEN=<token>" docker.elastic.co/elasticsearch/elasticsearch:8.2.0`
修改elasticsearch默认密码(注意:这里修改的是数据库用户elastic的密码,而不是系统用户)
./elasticsearch-reset-password --username elastic -i
This tool will reset the password of the [elastic] user.
You will be prompted to enter the password.
Please confirm that you would like to continue [y/N]y
Enter password for [elastic]:       //输入新密码
Re-enter password for [elastic]:
Password for the [elastic] user successfully reset.
验证elasticsearch连接
curl -u "elastic:<你的密码>" -k "https://<你的服务器IP>:9200"返回以下信息表明es正常运行
{
  "name" : "es-elk-node1",
  "cluster_name" : "es-elk",
  "cluster_uuid" : "sGGoRcfvQ8KZidE55x-p7w",
  "version" : {
    "number" : "8.2.0",
    "build_flavor" : "default",
    "build_type" : "tar",
    "build_hash" : "b174af62e8dd9f4ac4d25875e9381ffe2b9282c5",
    "build_date" : "2022-04-20T10:35:10.180408517Z",
    "build_snapshot" : false,
    "lucene_version" : "9.1.0",
    "minimum_wire_compatibility_version" : "7.17.0",
    "minimum_index_compatibility_version" : "7.0.0"
  },
  "tagline" : "You Know, for Search"
}
添加systemd管理
vim /usr/lib/systemd/system/elasticsearch.service[Unit]
Description=elasticsearch
After=network.target
[Service]
Type=simple
User=es
Group=es
LimitNOFILE=100000
LimitNPROC=100000
Restart=no
ExecStart=/usr/local/elk/elasticsearch-8.2.0/bin/elasticsearch
PrivateTmp=true
[Install]
WantedBy=multi-user.targetsystemctl daemon-reload
systemctl enable elasticsearch --now #开机自启并立即启动安装kibana连接到es
useradd kibana      ##创建kibana账户
cd /usr/local/elk/
tar -zvxf kibana-8.2.0-linux-x86_64.tar.gz
chown -R kibana:kibana /usr/local/elk/kibana-8.2.0
cd kibana-8.2.0
vim config/kibana.yml
server.port: 5601
server.host: "<服务器IP>"配置systemd管理kibana
vim /usr/lib/systemd/system/kibana.service[Unit]
Description=kibana
After=network.target
[Service]
User=kibana
Group=kibana
ExecStart=/usr/local/elk/kibana-8.2.0/bin/kibana
ExecStop=/usr/bin/kill -15 $MAINPID
ExecReload=/usr/bin/kill -HUP $MAINPID
Type=simple
RemainAfterExit=yes
PrivateTmp=true
LimitFSIZE=infinity
LimitCPU=infinity
LimitAS=infinity
LimitNOFILE=65535
LimitNPROC=64000
LimitMEMLOCK=infinity
TasksMax=infinity
TasksAccounting=false
[Install]
WantedBy=multi-user.targetsystemctl daemon-reload
systemctl enable kibana --now浏览器访问kibana:https://<服务器IP>:5601
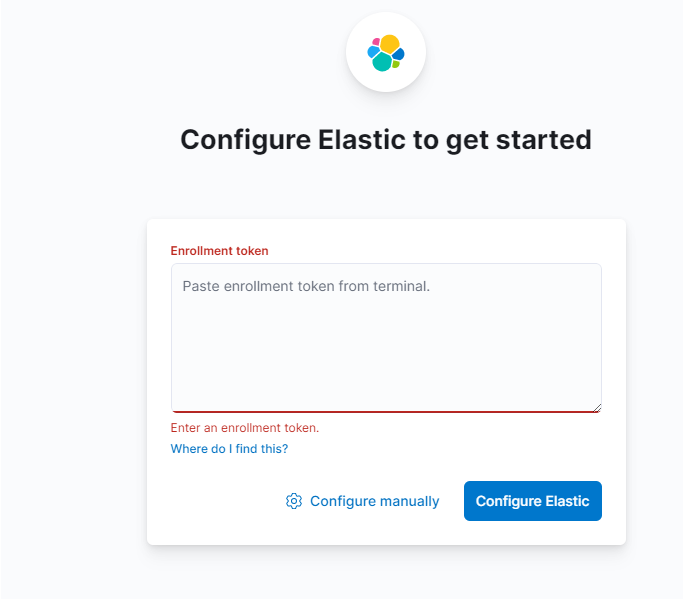
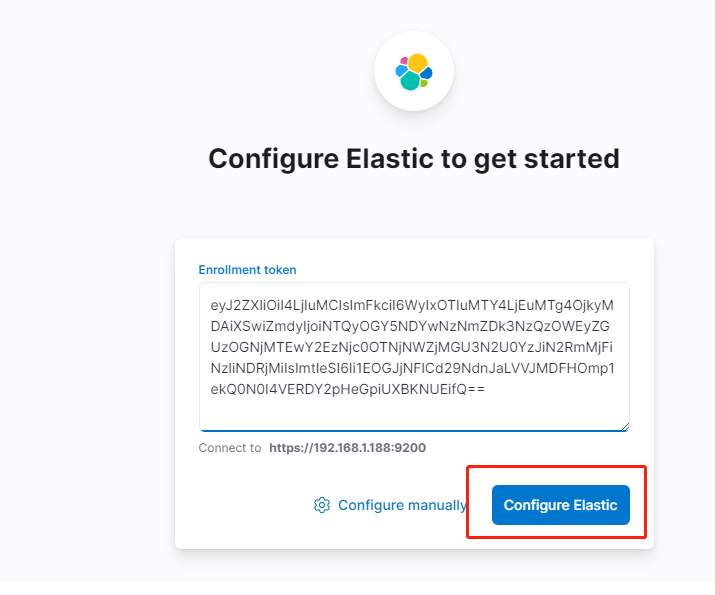
需要输入首次启动es时提示的token,如果超过30分钟,则执行以下命令重新生成:
cd /usr/local/elk/elasticsearch-8.2.0/bin/
./elasticsearch-create-enrollment-token --scope kibana
将上面脚本输出的token粘贴到浏览器中
需要生成验证码:
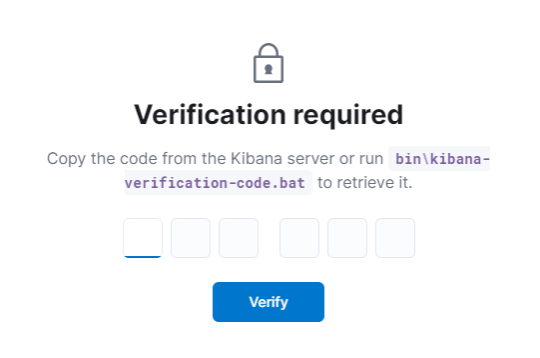
cd /usr/local/elk/kibana-8.2.0/bin/
./kibana-verification-code
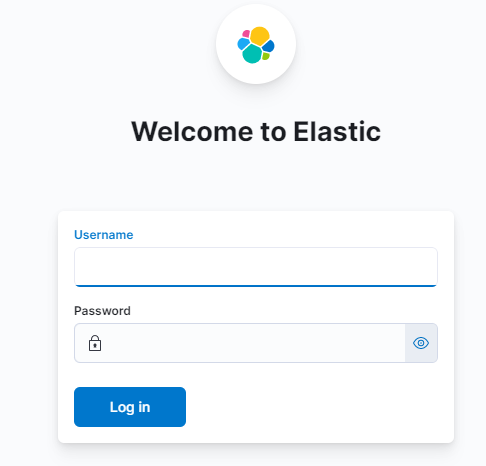
#Your verification code is: 801 778将验证码输入验证之后kibana连接es完成,可以使用es的elastic账号登录kibana管理es
制作filebeat基础镜像
mkdir -pv /usr/local/elk/filebeat-8.2.0
cd /usr/local/elk/filebeat-8.2.0
vim Dockerfile
编写Dockerfile文件
#filebeat 8.2.0 base images
FROM debian:jessie

ENV FILEBEAT_VERSION 8.2.0

RUN apt-get update && \
    apt-get -y install wget --force-yes && \
    wget https://artifacts.elastic.co/downloads/beats/filebeat/filebeat-${FILEBEAT_VERSION}-linux-x86_64.tar.gz && \
    tar xzf filebeat-${FILEBEAT_VERSION}-linux-x86_64.tar.gz && \
    mv filebeat-${FILEBEAT_VERSION}-linux-x86_64/filebeat /usr/local/bin && \
    rm -rf /filebeat* && \
    apt-get -y remove wget && \
    apt-get -y autoremove

COPY filebeat.yml /etc/filebeat/
RUN chmod go-w /etc/filebeat/filebeat.yml

CMD ["/usr/local/bin/filebeat", "-e", "-c", "/etc/filebeat/filebeat.yml"]
编写filebeat基础配置文件,放在Dockerfile同一目录
vim filebeat.yml
filebeat.inputs:
- type: filestream
  paths:
    - "/data/logs/*.log"
  id: ${TOPIC_ID}/${APP_NAME}
  enabled: true
  parsers:
  - multiline:
      type: pattern
      pattern: '^\d{4}-\d{1,2}-\d{1,2}'
      negate: true
      match: after
      max_lines: 1000
      timeout: 3s
  - multiline:
      type: pattern
      pattern: '^[[:space:]]'
      negate: false
      match: after
      max_lines: 1000
      timeout: 3s
  fields:
    host: ${NODE_NAME}
    log_topic: ${TOPIC_ID}
    app_name: ${APP_NAME}
output.kafka:
  hosts: ["<kafka服务器的IP>:9092"]
  topic: ${TOPIC_ID}
  partition.round_robin:
    reachable_only: false
  required_acks: 1
  compression: gzip
  max_message_bytes: 1000000

logging.level: ${LOG_LEVEL:error}
构建出filebeat镜像push到镜像仓库
注意:kafka是一个可选组件,filebeat可以配置为将日志直接输出到logstash或es,根据需求选择,此处不再对kafka的安装过程做描述。
安装Logstash
tar -zvxf logstash-8.2.0-linux-x86_64.tar.gz
/usr/local/elk/logstash-8.2.0/config/conf
vim kafka-to-es.conf
编辑配置文件
将<KAFKA服务器IP>替换为具体的服务器IP
将<k8s_namespace>替换为要收集日志的k8s名称空间
<es服务器IP>为安装es的服务器IP
<你的elastic账户密码>为之前修改过的elastic账户密码
注意:如果你的elasticsearch开启了tls加密传输,则需要通过cacert指定ca证书路径,es安装完成后证书默认放在/usr/local/elk/elasticsearch-8.2.0/config/certs/
input {
  kafka {
    bootstrap_servers => "<KAFKA服务器IP>:9092"
    topics => ["<k8s_namespace>"]
    codec => "json"
  }
}
output {
  if [fields][log_topic] == "<k8s_namespace>" {
    elasticsearch {
      hosts => ["https://<es服务器IP>:9200"]
      ilm_enabled => true
      ilm_rollover_alias => "<k8s_namespace>-log"
      ilm_pattern => "s<k8s_namespace>-{now/d}-000001"
      ilm_policy => "elk_log_ilm_policy"
      cacert => '/usr/local/elk/logstash-8.2.0/config/certs/http_ca.crt'
      user => elastic
      ssl => true
      password => "<你的elastic账户密码>"
    }
  }
}
配置systemed管理logstash
vim /usr/lib/systemd/system/logstash.service[Unit]
Description=Logstash
Requires=network.service
After=network.service
[Service]
LimitNOFILE=65536
LimitMEMLOCK=infinity
ExecStart=/usr/local/elk/logstash-8.2.0/bin/logstash -f /usr/local/elk/logstash-8.2.0/config/conf/kafka-to-es.conf
ExecReload=/bin/kill -HUP $MAINPID
KillMode=mixed
SuccessExitStatus=143
Restart=on-failure
RestartSec=42s
[Install]
WantedBy=multi-user.targetsystemctl daemon-reload
systemctl enable kibana --now至此,我们基础的日志收集架构已经搭建完成
示例:将Filebeat作为Sidecar收集容器日志
apiVersion: apps/v1
kind: Deployment
metadata:
  name: deploy-demo
  labels:
    app: demo
spec:
  replicas: 1
  selector:
    matchLabels:
      app: demo
  template:
    metadata:
      labels:
        app: demo
    spec:
      containers:
        - name: demo
          image: xxxx/xxxx:xx
          imagePullPolicy: Always
          ports:
            - containerPort: 80
          livenessProbe:
            tcpSocket:
              port: 89
            initialDelaySeconds: 3
            periodSeconds: 60
          readinessProbe:
            tcpSocket:
              port: 3000
            initialDelaySeconds: 3
            periodSeconds: 60
          lifecycle:
            preStop:
              exec:
                command: ["sleep 15"]
          resources:
            limits:
              memory: "1024Mi"
              cpu: "300m"
            requests:
              memory: "100Mi"
              cpu: "50m"
          volumeMounts:
            - name: log-dir
              mountPath: /data/logs
        - name: filebeat
          image: <filebeat镜像地址>
          imagePullPolicy: Always
          resources:
            limits:
              cpu: "50m"
              memory: "200Mi"
          env:
            - name: TOPIC_ID
              valueFrom:
                fieldRef:
                  fieldPath: metadata.namespace
            - name: APP_NAME
              valueFrom:
                fieldRef:
                  fieldPath: metadata.labels['app']
            - name: POD_NAME
              valueFrom:
                fieldRef:
                  fieldPath: metadata.name
            - name: NODE_NAME
              valueFrom:
                fieldRef:
                  fieldPath: spec.nodeName
            - name: LOG_LEVEL
              value: error
          volumeMounts:
            - name: log-dir
              mountPath: /data/logs
      volumes:
        - name: log-dir
          emptyDir: {}
搭建SolopaceGem组网访问内部filebeat管理页面
在kibana所在的服务器上安装SolopaceGem Linux客户端
curl -fsSL https://solopace.doaction.pro/download/sh/install.sh | sh -s stable
#安装后执行solopacegem up获取组网链接,复制到浏览器打开后按照指引操作
https://solopace.yuque.com/org-wiki-solopace-ftgrkb/hmtfrc/mt9p833y8eceouxg
在管理客户端安装SolopaceGem客户端:
参考文档:https://solopace.yuque.com/org-wiki-solopace-ftgrkb/hmtfrc/evlpy39e77qn7956
完成管理客户端与filebeat服务器的组网后,即可通过https://<kibana服务器组网IP>:5601访问管理页面
